
Model answer — Band 8
Written by WriteReady AI and reviewed by our team · 194 words
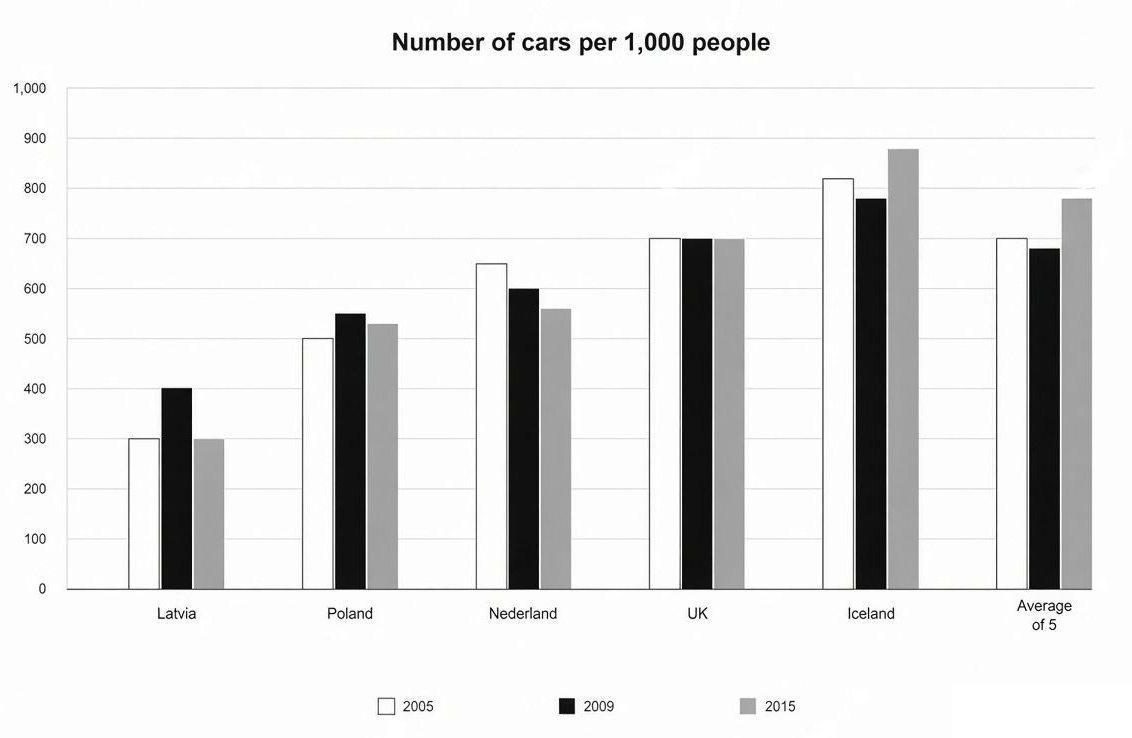
The bar chart displays the number of cars per 1,000 people across five European countries—Latvia, Poland, the Netherlands, the UK, and Iceland—over three years: 2005, 2009, and 2015, alongside the European average.
Overall, car ownership increased in most countries between 2005 and 2015. Iceland had the highest car ownership rate, reaching 875 cars per 1,000 people by 2015, while Latvia had the lowest, with only 300 cars per 1,000 people in 2005, rising to just 400 by 2009. The European average grew from 700 cars per 1,000 people in 2005 to 775 by 2015.
Looking at individual countries, Poland showed steady growth, climbing from 500 in 2005 to 545 in 2015. The Netherlands and the UK exhibited more modest increases, both reaching approximately 700 cars per 1,000 people in 2015, with the UK showing a slight dip from 700 to 700 across the period. Iceland demonstrated the most dramatic rise, increasing from 815 in 2005 to 875 in 2015. Between 2009 and 2015, most countries maintained relatively stable levels, with the exception of Iceland, which continued its upward trajectory. Latvia remained the least motorised nation throughout the period, though it did experience some growth.