
Model answer — Band 8
Written by WriteReady AI and reviewed by our team · 192 words
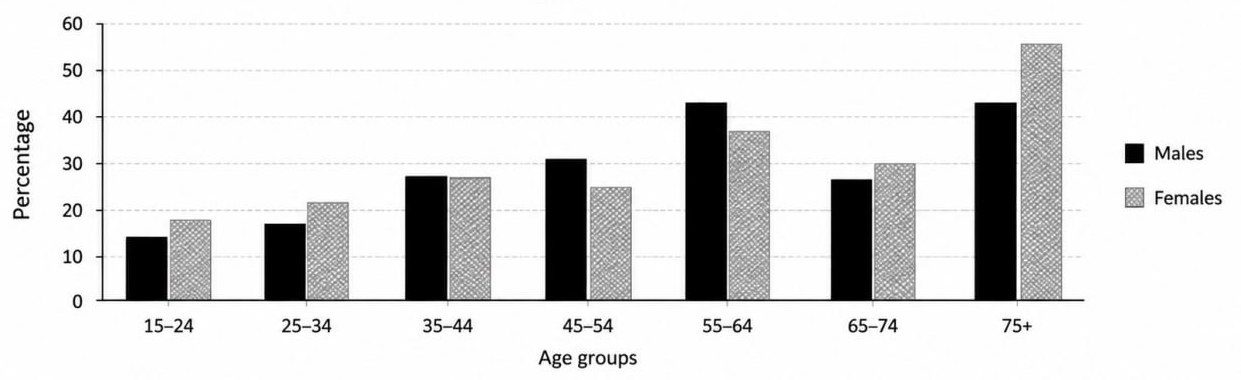
The bar chart displays the percentage of physically inactive adults in Australia, broken down by age group and gender.
Overall, physical inactivity increases with age for both males and females. Younger adults aged 15–24 show the lowest rates, with males at 14% and females at 18%. These figures rise progressively through the middle age groups, reaching their peak in the 75+ category, where males account for 44% and females for 56%.
Comparing genders across age groups reveals that females are consistently more sedentary than males, except in the youngest bracket. The gap widens significantly in older age groups. In the 55–64 age range, females reach 38% compared to males at 43%, but by the 75+ category, females exceed males substantially at 56% versus 44%.
The most notable increase occurs between the 65–74 and 75+ age groups. For females, inactivity jumps from 31% to 56%, a rise of 25 percentage points. Males show a similar trend, increasing from 27% to 44%, a 17-point increase. The data suggests that advancing age is a significant factor in determining physical activity levels, with the elderly population showing markedly lower engagement in physical exercise regardless of gender.