
Model answer — Band 8
Written by WriteReady AI and reviewed by our team · 192 words
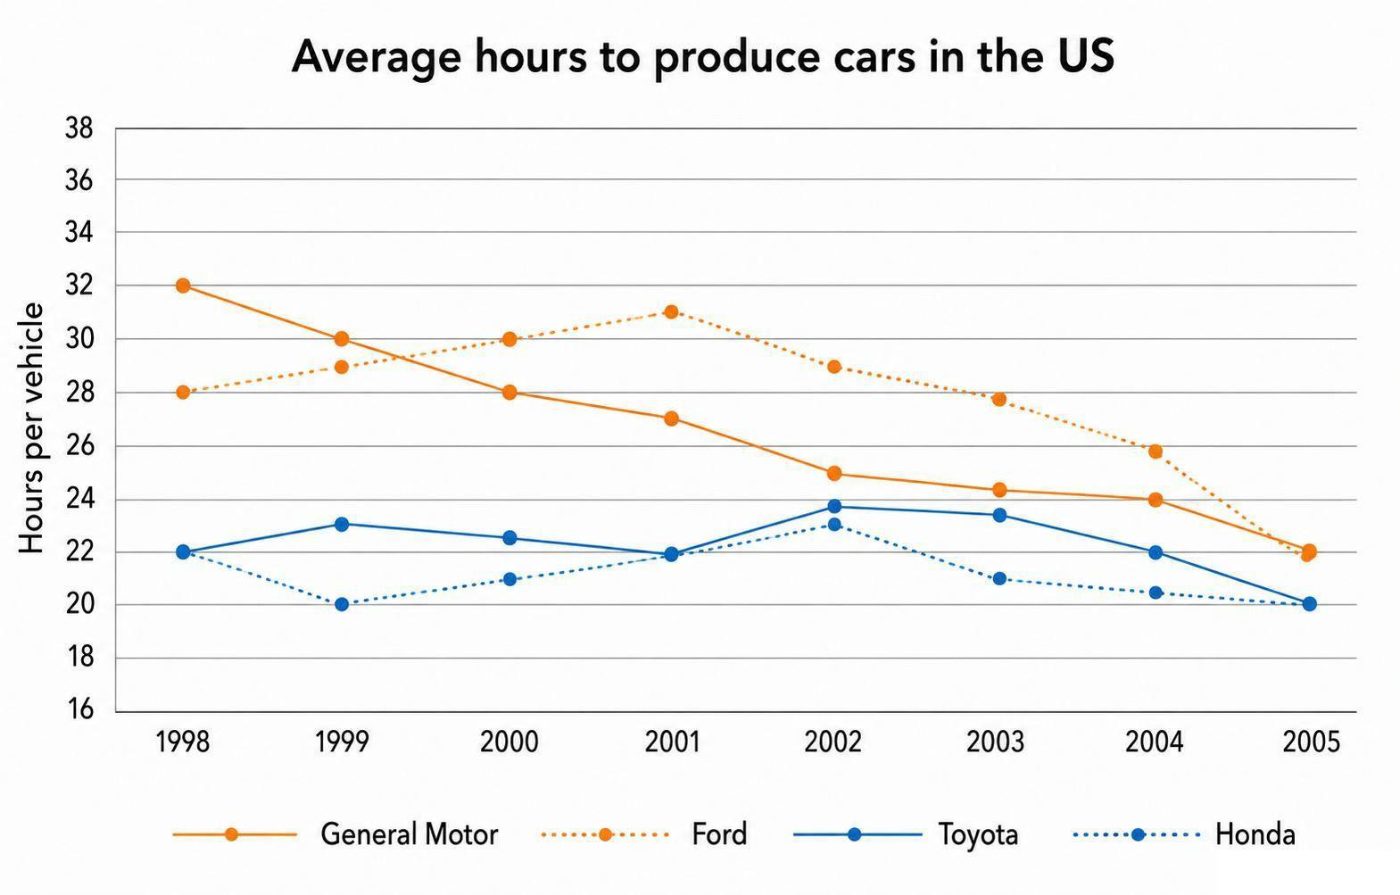
The graph illustrates how the average production time for cars at four US manufacturers changed between 1998 and 2005.
General Motors began at 32 hours per vehicle in 1998 and showed a steady downward trend, declining to 22 hours by 2005. Ford started at 28 hours, rose slightly to 30 hours in 1999, then fell overall to 22 hours in 2005, mirroring General Motors' final position. Toyota maintained relatively stability throughout the period, fluctuating between 20 and 23.5 hours, with its peak at 23.5 hours in 2002. Honda showed the most variation, starting at 22 hours, dropping to 20 hours in 1999, then climbing to 23 hours in 2002 before declining again to 20 hours by 2005.
The most significant observation is that General Motors and Ford began with substantially higher production times than Toyota and Honda. Over the seven-year period, all manufacturers converged, with General Motors and Ford both reaching 22 hours by 2005, aligning them with Toyota and Honda. This convergence suggests that the Japanese manufacturers maintained consistently efficient production processes, while the American manufacturers made considerable improvements, narrowing the gap through process optimization and efficiency gains during this period.