
Model answer — Band 8
Written by WriteReady AI and reviewed by our team · 190 words
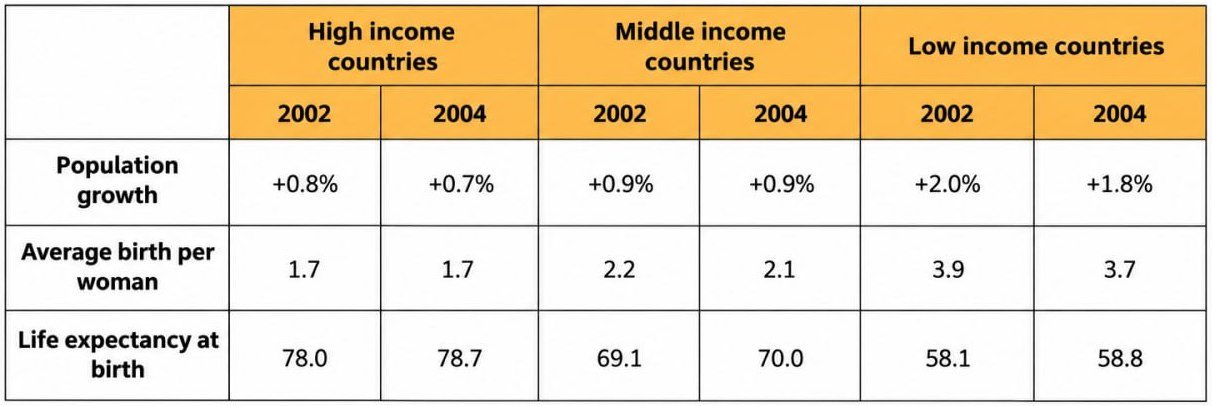
The table presents demographic data for three income-based country groups in 2002 and 2004. Key measurements include population growth rates, average births per woman, and life expectancy at birth.
High-income countries showed the most stable demographics. Population growth decreased marginally from 0.8% to 0.7%, while the average birth rate remained constant at 1.7 children per woman. Life expectancy improved slightly, rising from 78.0 to 78.7 years.
Middle-income countries experienced modest growth across all indicators. Population growth remained steady at 0.9% in both years, whereas the average birth rate declined fractionally from 2.2 to 2.1 children per woman. Life expectancy increased from 69.1 to 70.0 years, representing a meaningful one-year improvement.
Low-income countries demonstrated the highest overall growth but also declining fertility. Population growth decreased from 2.0% to 1.8%, and the birth rate fell from 3.9 to 3.7 children per woman. Despite these declines, life expectancy rose marginally from 58.1 to 58.8 years, indicating limited health improvements.
Overall, low-income countries maintained significantly higher growth rates and birth rates than wealthier nations, while life expectancy gaps between income groups remained substantial. The data suggests that demographic transition accelerates with rising income levels.